Overfitting in Product Management: when to stop thinking and start shipping
Applying Machine Learning algorithms in daily life as a PM

Hello beautiful souls,
I took a 20-credit Machine Learning course at uni for my recently acquired MSc degree in Fintech and Policy. Although I’m not a hype AI PM now, you’d be sure as heck this painstaking course is put to work with my reflection.
The topic I’m going to discuss today is about overfitting in product management and how to overcome it. I came across this topic when I read “Algorithms to Live by” written by Brian Christian and Tom Griffiths.
In chapter 7, the authors talk about overfitting. And I want to put the overfitting in a PM context. But first of all, what is overfitting?
I’m going to start back with data collection, presentation, and forecast. I’m going (to the best of my ability) to leave out technical jargon so that this article is enjoyable to diverse readers.
Now, suppose you’ve got an assignment to start research on consumer behaviour in buying ice cream during winter (yes, people who do this exist, at least my neighbours do). The easiest and most foolproof way for you to conduct the research is by distributing a survey containing a questionnaire about their ice cream purchasing behaviour. (Tbh I’m not sure why I keep bringing up survey topics in these 2 consecutive posts. My last post and its Medium counterpart talk deeper about this)
It’s in the bleak midwinter and your mind is filled with spending Christmas or winter holiday at home with your family or furry friends, bundled up in cosy sweatshirts and pyjamas. Or, if you live in warmer parts of the world, you might still look forward to the long holiday people usually take between Christmas and New Year, or in Indonesia we portmanteau it as Nataru (Natal == Christmas, and Tahun Baru == New Year. Hence Natal + Tahun Baru = Nataru).

(my daily Scottish tea, I don’t eat ice cream)
So, to heck with your research plan, isn’t it? Why would you want to go outside in the cold or rainy season to interview people? Online survey it is. You designed your questionnaire and distributed it to the people. For the sake of getting to the point with the topic, I won’t delve into the technical details of surveying your targets.
Then, a week later, you’re buried with survey data up your neck. It’s 2 weeks before the year-end holiday and you still need to provide the executive summary for the board. Oh, I forgot to mention the research objective (although I mentioned it as the first, the primary, thing to define in your user research). Your company board wants to see the correlation between the temperature outside and the time of the day when people buy ice cream with the revenue forecast. To make my imagination more believable, let’s assume your company is an ice cream van vendor. By knowing this sales pattern, they can better negotiate their van rental price with the ice cream companies.
Skipping the horrendous part of plugging the data into the spreadsheet or number processor of your choice (Excel or Google Sheets, perhaps, not demonising anything, here), or even if you want to go slightly more advanced by running your Python script, you must come up with the correlation analysis. You must define the relationship, alright? (Not your relationship with . . . , oops sorry I’ve gone too far)
Anyway, the simplest way to define the relationship between different numbers (since temperature and time are numbers, regardless of how you want to represent them as variables), is linear regression. You want to make a straight line. Oh, wait, this is where the technicality comes into play but I want to explain it as easily as possible.
You’ve got 2 variables to plot: temperature and time, and 1 variable as a result of the interaction between the other 2 variables. So, your final plot is a 3D one. Imagine the 3-axis plot of X, Y, and Z axes. The X is the temperature, Y is time, and Z is the revenue.
If this explanation bogs you down, just imagine a 2D plot of 1 variable X and 1 result variable revenue. The term for the X (or X and Y) are the independent variables, and the Z is the dependent variable.
Say, your regression has been defined, and you’ve got your plot.
But, how good is your curve in fitting the data? Imagine you managed to get a response from 100 respondents. And assume you use only 1 independent variable, which curve you’d get? Is it linear linear, or curvy, or quadratic?
The image below summarises the problem.
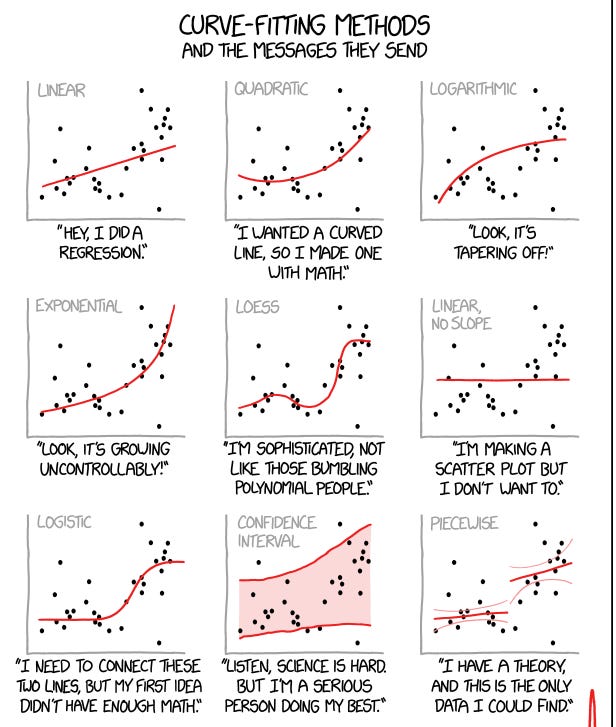
As the name suggests, overfitting means overly fitting the resulting curves to the data points. If there are 100 data points, and the distribution isn’t linear, the curve will be warped in odd shapes, resembling polynomial equations.
(for a more technical explanation, one way to achieve that overfitting is to expand the variable into polynomial ones, e.g. making a quadratic variable. Another way is to introduce more variables or factors into the equation, such as the ice cream flavours, the suburban population density, and so on, similar to the logic of the 3D curve above. And 4D, 5D, and so on . . . )
Underfitting means giving up on fitting the shape of the curve of the intended correlation equation and just taking too generic of a trend.
Why overfitting is bad?
Because you want to draw a lesson to predict the future! The key word here is to predict. It means that the future is uncertain. And you want to ensure that your prediction (or in ML language, your model) is flexible enough to tackle the uncertainties in the form of irregular data or measurement results. The book warns us that overfitting threatens confidence in the model by conforming the correlation equation to noises. In terms of noise-to-signal ratio, what good could it be to tailor your models to the noisy data instead of the actual signals?
The funny thing about this overfitting chapter of the book is it also discusses the danger of overfitting throughout human evolution that over-corrects our taste buds to surrender to hyper-palatable foods that are rich in fat and sugar excessively because in the past, they were relatively unattainable.
The “over” in overfitting makes us pay more for the prediction behaviour.
Overfitting in Product Management
So, what about the overfitting in product management?
Here are a few examples, as food for thought.
1/ The way we blindly follow the metrics to gauge our product success, and craft rollout strategy to meet the criteria.
This is my guilty strategy as well. As long as I knew what the metric was, I turned a blind eye towards less quantifiable metrics that might be more critical in driving the conversion in the future, such as customer satisfaction.
The easiest metric I can mention here is the deadline. To meet a deadline, sometimes features must be shaved off. Ultimately, the well-defined MVP might look more than 50% different from what was agreed on due to the time constraint.
Although the topic of defining metrics here is a whole lot another content idea, which might open a can of worms, I warn you, in general, that metrics are a gateway for overfitting. Selecting a wrong metric, fitting the product strategy to achieve the key result based on that metric, measuring the wrong thing . . . the list could go on.
2/ Building something out of past performance or competitors’ success
Raise your hand if you’re guilty of this (me raising my hand 🙋🏻♀️ as soon as I finished typing this).
Guilty as charged.
This is similar to determining future stock prices based on historical technical indicators (that’s why many websites mention the disclaimer that their information is not financial advice and the customers should trade at their own risk).
A good word to keep reminding me of how the market behaves is:
The market can stay irrational much longer than you stay solvent,
according to John Keynes.
(or so)
Past performance of competitors’ success is quantifiable, but please practise discretion in taking which elements to emulate in your next feature.
But to decide on which to emulate . . . you need data, right? And the survey data can be overfitted.
Yup.
So, what’s the mathematical best practice to combat overfitting?
Regularisation, or the techniques to penalise the complexity of the model.
In machine learning, there are at least 2 that I learned: L1 (Lasso Technique) and L2 (Ridge Regression).
Despite not being able to recall their exact differences on the top of my head (yeah, I’m not a Data PM), the idea is that from those many factors or variables that we include in the model, only a few contribute more. Think about it as a Pareto effect, that the result determinants are maybe only 20% of the factors.
In real life, without the ML models to govern the prediction, how and when do I stop overfitting and start taking action?
Early Stopping mechanism is the key. Similar to the early stopping in the ML algorithm, there are best practices to follow that save you time and effort while not sacrificing much for the quality of your prediction.
Sprint suggests stopping interviewing after 5 people, the pain points would be visible by observing these five.
The survey result is good to give you an idea of the quantitative positions of your research topic. Bu judgment is required. Judgment might be wrong. Hence, releasing an MVP that is functional and covers the areas you want to test is the immediate next step.
The rule of 37. It’s in the chapter 1 of the same book.
So, how do you think science can help you in solving your daily life problems? Comment below for your experience and share this post.
If you enjoy this content, have you done the following?
📖 Subscribe to my Medium to elevate your leadership and PM skills
💡Grab your free 30-minute session of 1:1 career or product management coaching
And, let’s get connected on LinkedIn.
Until then,